
Almost a decade ago I shared a process that my domestic polyfamily and I had been using (by then, for around four years) to manage our household finances. That post isn't really accurate any more, so it's time for an update (there's a link if you just want the updated spreadsheet):

Alt
Dan, wearing a WordPress Pride "rainbow flag on black" t-shirt, sits on a park bench alongside a French Bulldog (with her tongue sticking out) and a young boy (throwing a peace sign, wearing a pink cycle helmet and a blue school uniform).
Sample data
For my examples below, assume a three-person family. I'm using unrealistic numbers for easy arithmetic.
- Alice earns £2,000, Bob earns £1,000, and Chris earns £500, for a total household income of £3,500.
- Alice spends £1,450, Bob £800, and Chris £250, for a total household expenditure of £2,500.
Model #1: Straight Split
We've never done things this way, but for completeness sake I'll mention it: the simplest way that households can split their costs is by dividing them between the participants equally: if the family make a £60 shopping trip, £20 should be paid by each of Alice, Bob, and Chris.
My example above shows exactly why this might not be a smart choice: this model would have each participant contribute £833.33 over the course of the month, which is more than Chris earned. If this month is representative, then Chris will gradually burn through their savings and go broke, while Alice will put over a grand into her savings account every month!

Alt
Photograph of the Statue of Lenin in Independence Square, Minsk: Government House #1 stands behind a large metal statue of Vladimir Lenin, looking to his right.
Model #2: Income-Assessed
We're a bunch of leftie socialist types, and wanted to reflect our political outlook in our household finances, too. So rather than just splitting our costs equally between us, we initially implemented a means-assessment system based on the relative differences between our incomes. The thinking was that somebody that earns twice as much should contribute twice as much towards the costs of running the household.
Using our example family above, here's how that might look:
- Alice earned 57% of the household income, so she should have contributed 57% of the household costs: £1,425. She overpaid by £25.
- Bob earned 29% of the household income, so he should have contributed 29% of the household costs: £725. He overpaid by £75.
- Chris earned 14% of the household income, so they should have contributed 14% of the household costs: £350. They underpaid by £100.
- Therefore, at the end of the month Chris should settle up by giving £25 to Alice and £75 to Bob.
By analogy: The "Income-Assessed" model is functionally equivalent to splitting each and every expense according to the participants income - e.g. if a £100 bill landed on their doormat, Alice would pay £57, Bob £29, and Chris £14 of it - but has the convenience that everybody just pays for things "as they go along" and then square everything up when their paycheques come in.

Alt
Photograph showing a detached white house clad in scaffolding, under a clear blue sky.
Over time, our expenditures grew and changed and our incomes grew, but they didn't do so in an entirely simple fashion, and we needed to make some tweaks to our income-assessed model of household finance contributions. For example:
- Gross vs Net Income: For a while, some of our incomes were split into a mixture of employed income (on which income tax was paid as-we-earned) and self-employed income (for which income tax would be calculated later), making things challenging. We agreed that net income (i.e. take-home pay) was the correct measure for us to use for the income-based part of the calculation, which also helped keep things fair as some of us began to cross into and out of the higher earner tax bracket.
- Personal Threshold: At times, a subset of us earned a disproportionate portion of the household income (there were short periods where one of us earned over 50% of the household income; at several other times two family members each earned thrice that of the third). Our costs increased too, but this imposed an regressive burden on the lower-earner(s), for whom those costs represented a greater proportion of their total income. To attempt to mitigate this, we introduced a personal threshold somewhat analogous to the income tax "personal allowance" (the policy that means that you don't pay tax on your first £12,570 of income).
Eventually, we came to see that what we were doing was trying to patch a partially-broken system, and tried something new!
Model #3: Same-Residual
In 2022, we transitioned to a same-residual system that attempts to share out out money in an even-more egalitarian way. Instead of each person contributing in accordance with their income, the model attempts to leave each person with the same average amount of disposable personal income at the end. The difference is most-profound where the relative incomes are most-diverse.
With the example family above, that would mean:
- The household earned £3,500 and spent £2,500, leaving £1,000. Dividing by 3 tells us that each person should have £333.33 after settling up.
- Alice earned earned £2,000 and spent £1,450, so she has £550 left. That's £216.67 too much.
- Bob earned earned £1,000 and spent £800, so she has £200 left. That's £133.33 too little.
- Chris earned earned £500 and spent £250, so she has £250 left. That's £83.33 too little.
- Therefore, at the end of the month Alice should settle up by giving £133.33 to Bob and £83.33 to Chris (note there's a 1p rounding error).
That's a very different result than the Income-Assessed calculation came up with for the same family! Instead of Chris giving money to Alice and Bob, because those two contributed to household costs disproportionately highly for their relative incomes, Alice gives money to Bob and Chris, because their incomes (and expenditures) were much lower. Ignoring any non-household costs, all three would expect to have the same bank balance at the start of the month as at the end, after settlement.
By analogy: The "Same-Residual" model is functionally equivalent to having everybody's salary paid into a shared bank account, out of which all household expenditures are paid, and at the end of the month everything that's left in the bank account gets split equally between the participants.
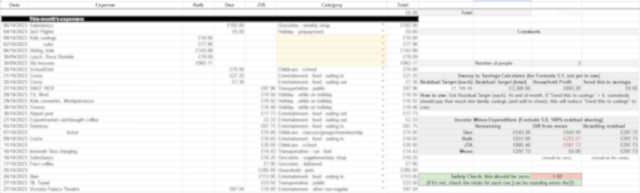
Alt
Screenshot showing a sample filled verison of the spreadsheet.
We've made tweaks to this model, too, of course. For example: we've set a "target" residual and, where we spend little enough in a month that we would each be eligible for more than that, we instead sweep the excess into our family savings account. It's a nice approach to help build up a savings reserve without feeling a pinch.
I'm sure our model will continue to evolve, as it has for the last decade and a half, but for now it seems stable, fair, and reasonable. Maybe it'll work for your household too (whether or not you're also a polyamorous family!): take a look at the spreadsheet in Google Drive and give it a go.
Oh wow! We've been balancing between the exact same three models. I was hoping I wasn't mad by having those three options in my mind, glad to know others have had the same thought process.
I really love that all three options can be considered "fair", depending on personal definitions of fairness, and it's very interesting to reflect on which choice one personally does consider fair..
We're still settled on option 2, but with some minimum disposable income threshold. Especially when there's a zero income member of the household.
Option 3 definitely comes to mind fairly often, but I remain a little nervous of it with the above? And a bit uncertain how costs like rail tickets to get to work might land in that case.
And can be generally tricky to understand what is a household expense and what is not? A classic being groceries for the week getting shared, even if there's a disproportionate amount of ice cream for yours truly >_>;;