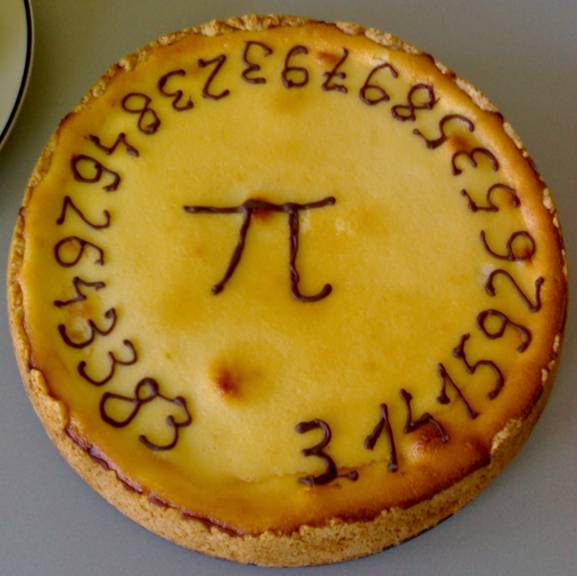
So, I’ve not been well lately. And because a few days lying on my back with insufficient mental stimulation is a quick route to insanity for me, I’ve been trying to spend my most-conscious moment doing things that keep my brain ticking over. And that’s how I ended up calculating pi.
Pi (or π) is, of course, the ratio of the circumference of a circle to its diameter, for every circle. You’ll probably have learned it in school as 3.14, 3.142, or 3.14159, unless you were one of those creepy kids who tried to memorise a lot more digits. Over the years, we’ve been able to calculate it to increasing precision, and although there’s no practical or theoretical reason that we need to know it beyond the 32 digits worked out by Ludolph van Ceulen in the 16th Century, it’s still a fascinating topic that attracts research and debate.

Most of the computer-based systems we use today are hard to explain, but there’s a really fun computer-based experimental method that can be used to estimate the value of pi that I’m going to share with you. As I’ve been stuck in bed (and often asleep) for the last few days, I’ve not been able to do much productive work, but I have found myself able to implement an example of how to calculate pi. Recovery like a nerd, am I right?
Remember in school, when you’ll have learned that the formula to describe a circle (of radius 1) on a cartesian coordinate system is x2 + y2 = 1? Well you can work this backwards, too: if you have a point on a grid, (x,y), then you can tell whether it’s inside or outside that circle. If x2 + y2 < 1, it’s inside, and if x2 + y2 > 1, it’s outside. Meanwhile, the difference between the area of a circle and the area of a square that exactly contains it is π/4.
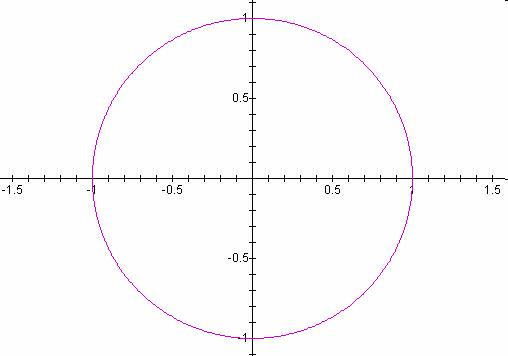
Take those two facts together and you can develop an experimental way to determine pi, called a Monte Carlo method. Take a circle of radius 1 inside a square that exactly contains it. Then randomly choose points within the square. Statistically speaking, these random points have a π/4 chance of occurring within the circle (rather than outside it). So if we take the number of points that lie within the circle, divide that by the total number of points, and then multiply by 4, we should get something that approaches the value of pi. You could even do it by hand!

The software illustration I’ve written is raw JavaScript, HTML, and SVG, and should work in any modern web browser (though it can get a little slow once it’s drawn a few thousand points!). Give it a go, here! When you go to that page, your browser will start drawing dots at random points, colouring them red if the sum of the squares of their coordinates is less than 1, which is the radius of the circle (and the width of the square that encompasses it). As it goes along, it uses the formula I described above to approximate the value of pi. You’ll probably get as far as 3.14 before you get bored, but there’s no reason that this method couldn’t be used to go as far as you like: it’s not the best tool for the job, but it’s super-easy to understand and explain.
Oh, and it’s all completely open-source, so you’re welcome to take it and do with it what you wish. Turn off the graphical output to make it run faster, and see if you can get an accurate approximation to 5 digits of pi! Or slow it down so you can see how the appearance of each and every point affects the calculation. Or adapt it into a teaching tool and show your maths students one way that pi can be derived experimentally. It’s all yours: have fun.
And I’ll update you on my health at some other point.
Sorry to hear you’re not well :( Hope you’re back on your feet soon!
Cool, but Firefox became unresponsive before I got past 3.1.
There is a theoretical (but not a practical) limit to this method, which is that it only works as long as your pseudo random number generator gives uniform results. The period for common PRNGs (e.g. Mersenne Twister) is something like 10^6000, so you could still surpass the current record before you start repeating points.
Monte Carlo method…flashbacks to grad school!!!!!!! Ahhhhhhhhhhhhhhh!!!!!!!!!!!!!!!!!!!!!!!
@scatmandan nice, there’s a daft elegance to that. With what’re you stricken? Remember when I was I’ll and you saw my special pants?
As I mentioned last week, I’ve been ill. For those who wanted the grisly details, well: here you go.
Warning: this blog post contains frank subjective descriptions of the symptoms of slightly-icky medical conditions including photographs. It’s probably safe for all audiences, but you might not want to be drinking anything while you read it.
The trouble began, I suppose, about a month and a half ago, when a contracted what seemed to be a minor urinary tract infection. If you’re a woman then, statistically-speaking, I probably don’t need to tell you what that is, but for the benefit of the men: it’s what happens when bacteria (or, sometimes, a fungus or virus) infects the renal system: the kidneys, bladder, ureters, and especially the urethra. It’s not pleasant: it gives you the feeling of needing to pee the whole time, makes it harder to pee, and – when you do – it feels a little bit like you’re piss is made of lava.
This urine contains white blood cells (the big circles) and bacteria (the tiny ‘wormlike’ things). Healthy urine contains little to none of these. Anybody else feel like they’re playing Spore?Despite it not being common for men (more on that later), I’ve had mild UTIs on a couple of occasions in my life, and I’d always found that ensuring that I got plenty of water and a full RDA of vitamin C was more than enough to make it clear up all by itself within a couple of days. So that’s what I started doing. But then things took a turn for the worse: I started getting a stabbing pain in my left kidney. Recognising this as being pyelonephritis, I went to the doctor who prescribed me a course of the antibiotic ciprofloxacin. Within a couple of days I was feeling right as rain (of course I continued to finish the course of drugs, although I was interested to see that that advice is starting to become controversial).
Happy, healthy, and out for a picnic.Naturally I was a little disappointed when, the week before last, I started getting UTI-like pain again, followed very swiftly this time by pain in my bladder that constantly felt a little like I was recovering from being punched. Back to the doctor I went, where (after the usual tests to work out what the most-likely best-antibiotic to use was) I was prescribed a course of nitrofurantoin. I’d never had this particular drug before, and it wasn’t initially clear which of the escalating ill-effects I was experiencing were symptoms of the infection and which were side-effects of the medication: it started with joint pain, then nausea, then diarrhoea, then a full-on fever. It was at the point that I was fully-clothed in bed, running a temperature and soaked in sweat but still feeling cold and shivering that Ruth called 111, who told her to take me to A&E.
(Which, like her care for me in general, she did fabulously well, except for a little bit where she sort-of ran me over in the car park of the hospital: thankfully some friendly paramedics were standing around and were able to drag me into the building. Anyway, I don’t have much memory of that bit and I certainly don’t have any amusing photos, so I’ll skip over it.)
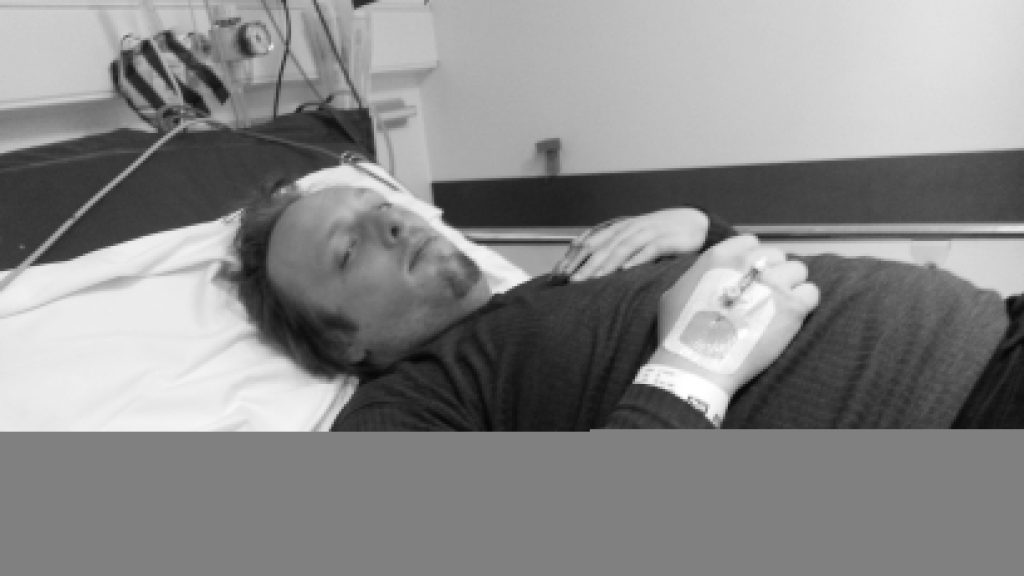
Feverish to the point of delirium, I don’t have much recollection of the first few hours(?) in the hospital. But I was alert enough to request that a photo was taken for the inevitable blog post. Ruth, however, insisted upon waiting until I apparently looked a lot less like I was about to die: so here it is!A few tests later, the medical staff seemed confident that what I was experiencing was not an allergic reaction to the antibiotic (however, I see that they still made a note of it as a risk on my notes!) but was a progression of the infection, which seemed to have crossed over from the tissues of my renal system and into my bloodstream and was now generally causing havoc by attacking the rest of my body. They hooked me up to a drip of an intravenous antibiotic and kept me stocked with painkillers, then sent me up to the urology ward and set me up with a “bed” (urology mostly deals with outpatients, and so my ‘bed’ was actually a trolley, but they wanted to keep me close to the urologists in case of any complications).
It was only the following morning, with the delirium passed, that I realised that I was on the sixth floor. Looking out of my window, I could just make out the spires of the Bodleian Library in the distance, so I dropped my coworkers an email to apologise for not being on my way there.A consultant switched me to a week’s course of yet-another different antibiotic – co-amoxiclav – and recommended keeping me in for another night. Now, I think that co-amoxiclav is a really interesting drug, so I’m going to be a bit of a nerd and tell you about that for a bit (I promise we’ll get back to my health in a moment: if you don’t want the science bit, just scroll past the diagrams to the next photo).
This is amoxicillin. I’ve highlighted in blue the lactam ring, which is the important bit.Co-amoxiclav is a mixture of two drugs. The first is the antibiotic amoxicillin. Amoxicillin belongs to a class of antibiotics (which includes penicillin) called β-lactams, which is the most-commonly used family of antibiotics. These antibiotics contain a four-point lactam ‘ring’ (highlighted in blue above), and the way that they work is that this part of the molecule bonds with a particular protein common to all gram-positive bacteria. Normally this protein is responsible for producing peptidoglycan, which is an essential ingredient in the cell walls of these kinds of bacteria, but when it gets locked to a β-lactam ring it stops working. As a result, when the bacterium reproduces the new child doesn’t have a proper cell wall, and can’t survive long in even the least-hostile environments.
Of course, we’re in a medical arms race right now because some of the bacteria which we’re targetting with antibiotics are becoming resistant. And here’s one what that they’re doing so: some of these bacteria have evolved to produce beta-lactamase, also bonds with beta-lactam rings, adding an OH to them and making them useless. Bummer, eh?
And this is clavulanic acid. Recognise that shape on the left-hand side of the molecule (highlighted in blue)? Yup: it’s another lactam ring.The second drug in co-amoxiclav, then, is clavulanic acid, which was discovered in the 1970s and started being added to drugs in the 1980s. Despite having a β-lactam ring (as you’ll see in blue above), clavulanic acid by itself it isn’t an effective antibiotic (for reasons I can’t quite get my head around – anyone want to help me?). But what it’s great at is bonding that lactam ring to beta-lactamase, thereby deactivating the bacterial counter-offensive and allowing the amoxicillin to carry on working, combating resistance.
So what you’ve got in co-amoxiclav is a an antibiotic and a chemical that counteracts the effects of a chemical that deactivates that antibiotic. Wow! It’s things like this that really make me wish I had a brain for biology!
These things aren’t terribly comfortable when you’re trying to sleep.I was eventually discharged from hospital and released to go home for lots of bed rest and water, along with a further week’s course of co-amoxiclav. Unfortunately it turns out that I’m one of the unlucky folks for whom amoxicillin makes me dizzy, so I spent most of that week lying down in-between wobbly vertigo-filled trips to and from the bathroom. But it worked! Within a few days I was feeling much better and by the end of last week I was able to work from home (and actually feel like I was useful again!).
Free of symptoms and off the drugs, I returned to work properly on Monday morning and everything seemed fine. Until, late in the morning, I went to the bathroom and started pissing blood.
I took a picture, but it’s too grim even for this blog post. Here, have a kitten instead. Do an image search for ‘gross haematuria’ if you want a clue: the kitten will still be waiting here when you need it.Now apparently blood in your urine, while horrifying when it happens to you unexpectedly, isn’t actually a sign of a medical emergency. I was starting to get bladder pain again, quite intensely, so I excused myself from work and called the urology ward, who decided that I wasn’t in bad enough a condition to go and see them but sent me straight to my GP, who gave me another fortnight’s worth of co-amoxiclav. They’re monitoring my progress with urine and blood samples and if by Friday it’s not having an impact, they’re going to want to send me back to hospital (hopefully only as an outpatient) and pump me full of the intravenous stuff again. So… fingers crossed for a good result out of these drugs.
My co-amoxiclav tablets each come individually wrapped in a nitrogen-filled foil bag. I’ve no idea what it is that they’re concerned that they’ll react with, but I’m eating three of them a day anyway.I was hoping that by this point I’d be writing this blog post and telling you all about how I’d fought the bladder monster and won. But it looks like I won’t be able to claim that victory for another week or two, yet. All I know is that I searched for “bladder monster” and found this. Yeah: that feels about right.
Read more →