At the very end of last year, right before the subsidy rate
dropped in January, I had solar panels installed: you may remember that I blogged about it at the time. I thought you might be interested to
know how that’s working out for us.
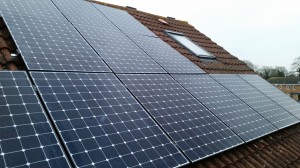
A power plant, right on top of our house. It’s very small – like, a “13” on Power Grid – but it’s ours.
Because I’m a data nerd, I decided to monitor our energy usage, production, and total cost in order to fully understand the economic impact of our tiny power station. I appreciate that
many of you might not be able to appreciate how cool this kind of data is, but that’s because you don’t have as good an appreciation of how fun statistics can be… it is cool,
damn it!
This stacked area chart, for example, shows our energy usage in KWh of each of gas and electricity for the last 8 months.
If you look at the chart above, for example (click for a bigger version), you’ll notice a few things:
We use a lot more KWh of gas than electricity (note that’s not units of gas: our gas meter measures in cubic feet, which means we have to multiply by around… 31.5936106… to
get the KWh… yes, really – more information here), but electricity is correspondingly 3.2 times more expensive per KWh – I have a separate chart to measure our daily energy costs, and it is if
anything even more exciting (can you imagine!) than this one.
Our gas usage grows dramatically in the winter – that’s what the big pink “lump” is. That’s sort-of what you’d expect on account of our gas central heating.
Our electricity usage has trended downwards since the beginning of the year, when the solar panels were installed. It’s hard to see with the gas scale throwing it off (but again,
the “cost per day” chart makes it very clear). There’s also a bit near the end where the electricity usage seems to fall of the bottom of the chart… more on that in a moment.
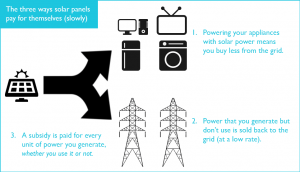
Solar panels (slowly) pay for themselves in three different ways. People often find it surprising that there aren’t only one or two.
What got me sold on the idea of installing solar panels, though, was their long-term investment potential. I had the money sitting around anyway, and by my calculations we’ll get a
significantly better return-on-investment out of our little roof-mounted power station than I would out of a high-interest savings account or bond. And that’s because of the
oft-forgotten “third way” in which solar panelling pays for itself. Allow me to explain:
Powering appliances: the first and most-obvious way in which solar power makes economic sense is that it powers your appliances. Right now, we generate
almost as much electricity as we use (although because we use significantly more power in the evenings, only about a third of what which we generate goes directly into making our
plethora of computers hum away).
Selling back to the grid (export tariff): as you’re probably aware, it’s possible for a household solar array to feed power back into the National Grid: so
the daylight that we’re collecting at times when we don’t need the electricity is being sold back to our energy company (who in turn is selling it,
most-likely, to our neighbours). Because they’re of an inclination to make a profit, though (and more-importantly, because we can’t commit to making electricity for them when they
need it: only during the day, and dependent upon sunlight), they only buy units from us at about a third of the rate that they sell them to consumers. As a result, it’s worth our
while trying to use the power we generate (e.g. to charge batteries and to run things that can be run “at any point” during the day like the dishwasher, etc.)
rather than to sell it only to have to buy it back.
From a government subsidy (feed-in tariff): here’s the pleasant surprise – as part of government efforts to increase the proportion of the country’s energy that
is produced from renewable sources, they subsidise renewable microgeneration. So if you install a wind turbine in your garden or a solar array on your roof, you’ll get a kickback for
each unit of electricity that you generate. And that’s true whether you use it to power appliances or sell it back to the grid – in the latter case, you’re basically
being paid twice for it! The rate that you get paid as a subsidy gets locked-in for ~20 years after you build your array, but it’s gradually decreasing. We’re getting paid a little
over 14.5p per unit of electricity generated, per day.
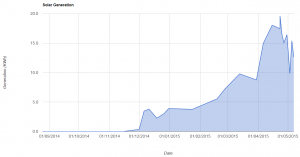
Late April was bright and sunny and we were able to generate up to 19 units per day (for contrast, we use around 12 units per day), but May has so-far been rainy and grey and we’ve
made only about 13 units per day.
As the seasons have changed from Winter through Spring we’ve steadily seen our generation levels climbing. On a typical day, we now make more electricity than we use. We’re still having
to buy power from the grid, of course, because we use more electricity in the evening than we’re able to generate when the sun is low in the sky: however, if (one day) technology like
Tesla’s PowerWall becomes widely-available at reasonable prices, there’s no reason that a house like ours couldn’t be totally
independent of the grid for 6-8 months of the year.
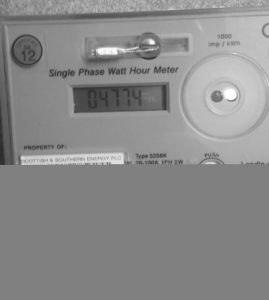
These guys came and replaced our electricity meter, because it was… umm… running backwards.
So: what are we saving/making? Well, looking at the last week of April and the first week of May, and comparing them to the same period last year:
Powering appliances: we’re saving about 60p per day on electricity costs (down to about £1.30 per day).
Selling back to the grid: we’re earning about 50p per day in exports.
From a government subsidy: we’re earning about £2.37 per day in subsidies.
As I’m sure you can see: this isn’t peanuts. When you include the subsidy then it’s possible to consider our energy as being functionally “free”, even after you compensate for the
shorter days of the winter. Of course, there’s a significant up-front cost in installing solar panels! It’s hard to say exactly when, at this point, I expect them to have paid for
themselves (from which point I’ll be able to use the expected life of the equipment to more-accurately predict the total return-on-investment): I’m planning to monitor the situation for
at least a year, to cover the variance of the seasons, but I will of course report back when I have more data.
Our new electricity meter, which replaced the old one – one of those with a “wheel”. The red light indicates that fraud has been detected. Yeah, about that…
I mentioned that the first graph wasn’t accurate? Yeah: so it turns out that our house’s original electricity meter was of an older design that would run backwards when
electricity was being exported to the grid. Which was great to see, but not something that our electricity company approved of, on account of the fact that they were then paying us for
the electricity we sold back to the grid, twice: for a couple of days of April sunshine, our electricity meter consistently ran backwards throughout the day. So they sent a couple of
engineers out to replace it with a more-modern one, pictured above (which has a different problem: its “fraud light” comes on whenever we’re sending power back to the grid, but
apparently that’s “to be expected”).
In any case, this quirk of our old meter has made some of my numbers from earlier this year more-optimistic than they might otherwise be, and while I’ve tried to compensate
for this it’s hard to be certain that my estimates prior to its replacement are accurate. So it’s probably going to take me a little longer than I’d planned to have an accurate
baseline of exactly how much money solar is making for us.