How I (Don’t) Collect Blog Statistics

Inspired by Becky‘s post How I Collect Blog Statistics, Respectfully,1 I thought I’d share what I do.2

tl;dr: I collect virtually nothing and I use even less.

Let me take you on a journey through the different kinds of analytics tools I’ve used:

1996 —1999: Hit counters!

My original websites used a hit counter that I wrote in Perl based on a sample from Matt’s Script Archive. Because I was edgy and dark, I made it look like this:

"Flaming" black-on-black digits 0-9.
I made the flaming digits using a stock effect in Corel Photo-Paint; this is an attempt to replicate the “feel” of them.

Hit counters are pretty dumb for a variety of reasons. Counting “hits” was never a terribly-representative reflection of the popularity of your pages. But also: because they’re a public representation of your popularity, there was every incentive to “game” them… even just by hitting refresh a couple of times. Making them untrustworthy and pointless.

1998 — 2006: Webalizer

Screenshot from The Webalizer, showing a bar chart of web stats covering September 2005.
Who can forget The Webalizer? Those Microsoft Excel ’97-grade barcharts!

Back in the day, “proper” web stats was something you did on your log files. Take log files, pump them through a program, get amalgamated output. And the king of these tools was The Webalizer.3

On a few of my websites – and some that I helped host for my friends – I’d have The Webalizer run daily, collating an archive of monthly stats plus “month-so-far” for the current month.

The Webalizer attempted to differentiate “hits” from “visitors”. And it tried to distinguish between browsers, and isolated bots, and tracked pulled referrer-data, and could even try to geolocate IP addresses. It was pretty magical for its time.

2006 2016 Google Analytics

I was an early adopter of Google Analytics: my site ID (“UA code”) was only five digits long!

Screenshot from an early version of Google Analytics, featuring a line graph covering visitors between April and May 2009, showing a 1,064.1% higher visitor counter than 'sites of a similar size' on one date.
Those graphs were slick for the Web technology of the day. A product of that period in the mid-naughties when Google made products that actually impressed users and didn’t just make them roll their eyes?

Google Analytics works via a JavaScript snippet which collects a variety of information about the visitor and sends it to Google’s mothership.

A third-party cookie that connected all Google Analytics-powered sites, plus everybody’s activity on other Google products, provided a wealth of data that you couldn’t get any other way. Want a gender breakdown of your visitors or their interests? Google can “help” you with that… and all the while, “helping” themselves to copies of all the data too.

If your website runs Google Analytics, it’s part of Google’s massive data-harvesting machine, monitoring people as they move around the Web. Webmasters trading away their visitors’ identities for some pretty charts seems pretty disgusting to me; it saddens me that I was ever “part of the problem”.

2015 2023 Piwik

Since around 2010, I’d been actively blocking Google Analytics, which made me feel a bit like a hypocrite to be inflicting it upon others. I looked for an alternative and found it in Piwik (now Matomo), an open-source and self-hosted analytics tool.

Screenshot from Piwik, showing a world map, graphs, and search keywords.
A self-hosted Piwik/Matomo installation provides almost the same level of useful depth as Google Analytics, but you get to keep your soul.

I ran Google Analytics and Piwik side-by-side to validate the latter, and found it to be excellent. Not only was it collecting data in a much more-ethical and respectful way, but it was also producing more-accurate results for my readership who, leaning somewhat “techie”, would sometimes block Google Analytics outright for all of the same reasons I did.

It was pretty good, but…

2023 — … (Almost) nothing?

…I don’t like the kind of blogger I am when I’m collecting stats!

It’s like… being a teenager again and having that hit counter, and getting excited when it goes up.  So what if a number went up? What does “popularity” mean? Isn’t the impact more important than the number of eyeballs?4

So in 2023, after winding my analytics down by instalments for many years, I just… stopped.5 I realised that so long as I was able to easily “watch the stats”, I’d be temped to write for the stats. To treat it as a score. To make the hit counter go up.6

That, in essence, is why I don’t really “do” any webstats any more. Analytics don’t serve me and the blogger I want to be, and they didn’t represent anything that I would consider a useful metric of success.

If somebody’s moved by what I do, that’s great: but a hit counter going up by one doesn’t tell me that; and it never did. Now if they leave a comment or drop me an email or even send me a postcardthat’s how I know that I made a difference!

Exception to the rule: GoAccess!

While I don’t actively watch the stats any more, I suppose I can still generate them, from my webserver logs, Webalizer-style. Except nowadays I’d probably use GoAccess:

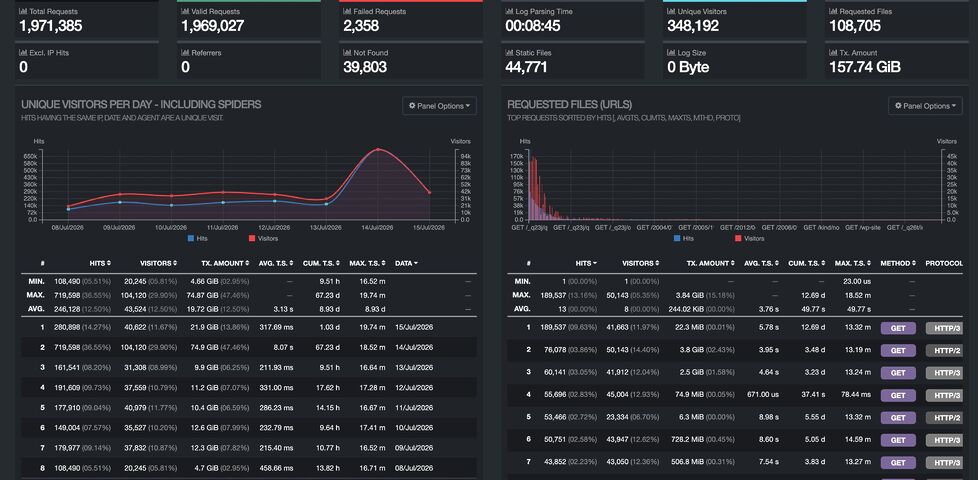
GoAccess dashboard for the last week, showing 1.9M requests by 350K visitors, pulling 160GB of data, with a big of a jump in traffic on 14 July.
There’s a bit of a “hump” where last week’s blog post about apps started trending on Bubbles, HackerNews, Lobste.rs and the like. But I knew that already because people sent me lots of comments!

There’s a script that I’m able to run, if I feel like it, to parse the most-recent of my Caddy logfiles. It takes about one minute to run per day of logs to process, and outputs a perfectly attractive self-contained HTML file.

Here’s that script:

#!/bin/bash
readonly LOG_DIR="/var/log/www/danq.me/"
readonly DAYS=7
readonly OUTPUT_HTML="/var/log/goaccess/danq.me.html"

sudo bash -c "{ find '$LOG_DIR' -maxdepth 1 -name 'access*.gz' -mtime -$DAYS -print0 | sort -z | xargs -0 zcat; cat '$LOG_DIR/access.log'; } | goaccess --log-format CADDY --output '$OUTPUT_HTML' -"

It’s not clever. It’s not sophisticated. It doesn’t use cookies or JavaScript or, indeed, anything other than what my webserver gives me for free.

I barely use it: maybe once every 18 months or so (today was the first time in well over a year). It’s there if I need it. And it’s inconvenient-enough to use that I’m not tempted to.

Footnotes

1 And perhaps also inspired to a lesser extent by Terence Eden‘s Reasonably accurate, privacy conscious, cookieless, visitor tracking for WordPress, which I’ve been thinking about on-and-off ever since I read it last year.

2 By “blog stats”, here, I mean statistics about visitors to my blog, not stats about my blogging (which I track and share in excruciating detail).

3 Did you know that the last point release of The Webalizer was in 2013 and the last feature release was in 2010: much later than I thought was the case!

4 Also, how do we even count “eyeballs”. Right now, about a fifth to a quarter of my visitors are bots. Amazonbot alone accounts for over 2% of my traffic. (I should probably tighten my robots.txt.)

5 Nowadays, there’s no tracking scripts whatsoever on my site. I don’t set a cookie unless you ask me to (and then it’s “transparent”: you can see exactly what it contains and what it’s for), I don’t try to fingerprint you in any way, I don’t even keep server logs longer than 60 days! Back when I used Jetpack I actively nerfed its stats-collection “features”. I don’t want your personal data!

6 Last week, I wrote a blog post about breaking into somebody’s “app” to make a web page that does the same things, but better. It attracted lots of comments, emails, and other feedback, so I can see it had impact. I have no idea how many eyeballs (or bots) saw it. That’s not the important bit.

× ×

How You Read My Content (The Answers)

This is a repost promoting content originally published elsewhere. See more things Dan's reposted.

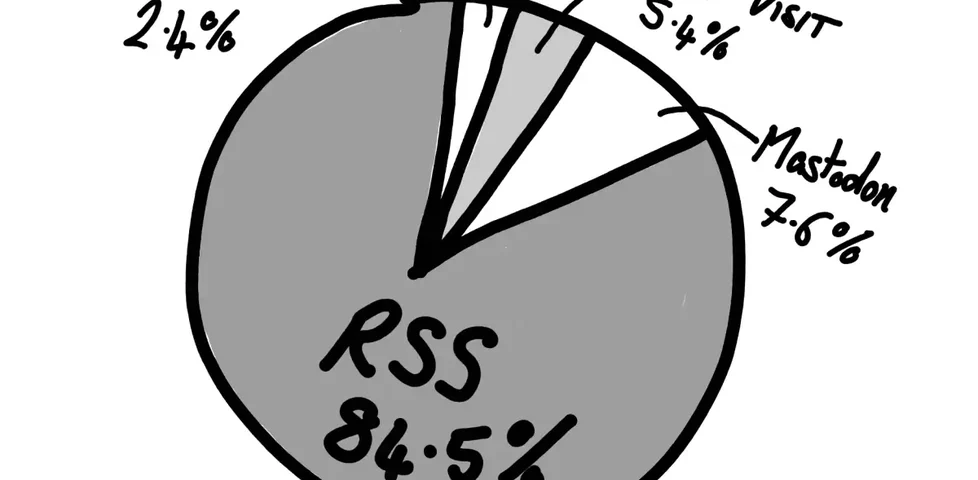
Reading type pie chart

What this tells me?

Well, quite a lot, actually. It tells me that there’s loads of you fine people reading the content on this site, which is very heart-warming. It also tells me that RSS is by far the main way people consume my content. Which is also fantastic, as I think RSS is very important and should always be a first class citizen when it comes to delivering content to people.

I didn’t get a chance to participate in Kev’s survey because, well, I don’t target “RSS Zero” and I don’t always catch up on new articles – even by authors I follow closely – until up to a few weeks after they’re published1. But needless to say, I’d have been in the majority: I follow Kev via my feed reader2.

But I was really interested by this approach to understanding your readership: like Kev, I don’t run any kind of analytics on my personal sites. But he’s onto something! If you want to learn about people, why not just ask them?

Okay, there’s going to be a bias: maybe readers who subscribe by RSS are simply more-likely to respond to a survey? Or are more-likely to visit new articles quickly, which was definitely a factor in this short-lived survey? It’s hard to be certain whether these or other factors might have thrown-off Kev’s results.

But then… what isn’t biased? Were Kev running, say, Google Analytics (or Fathom, or Strike, or Hector, or whatever)… then I wouldn’t show up in his results because I block those trackers3 – another, different, kind of bias.

We can’t dodge such bias: not using popular analytics platforms, and not by surveying users. But one of these two options is, at least, respectful of your users’ privacy and bandwidth.

I’m tempted to run a similar survey myself. I might wait until after my long-overdue redesign – teased here – launches, though. Although perhaps that’s just a procrastination stemming from my insecurity that I’ll hear, like, an embarrassingly-low number of responses like three or four and internalise it as failing some kind of popularity contest4! Needs more thought.

Footnotes

1 I’m happy with this approach: I enjoy being able to treat my RSS reader as sort-of a “magazine”, using my categorisations of feeds – which are partially expressed on my Blogroll page – as a theme. Like: “I’m going to spend 20 minutes reading… tech blogs… or personal blogs by people I know personally… or indieweb-centric content… or news (without the sports, of course)…” This approach makes consuming content online feel especially deliberate and intentional: very much like being in control of what I read and when.

2 In fact, it’s by doing so – with a little help from Matthias Pfefferle – that I was inspired to put a “thank you” message in my RSS feed, among other “secret” features!

3 In fact, I block all third-party JavaScript (and some first-party JavaScript!) except where explicitly permitted, but even for sites that I do allow to load all such JavaScript I still have to manually enable analytics trackers if I want them, which I don’t. Also… I sandbox almost all cookies, and I treat virtually all persistent cookies as session cookies and I delete virtually all session cookies 15 seconds after I navigate away from a its sandbox domain or close its tab… so I’m moderately well-anonymised even where I do somehow receive a tracking cookie.

4 Perhaps something to consider after things have gotten easier and I’ve caught up with my backlog a bit.

I don’t want your data

This is a repost promoting content originally published elsewhere. See more things Dan's reposted.

The web loves data. Data about you. Data about who you are, about what you do, what you love doing, what you love eating.

I, on the other end, couldn’t care less about your data. I don’t run analytics on this website. I don’t care which articles you read, I don’t care if you read them. I don’t care about which post is the most read or the most clicked. I don’t A/B test, I don’t try to overthink my content. I just don’t care.

Manu speaks my mind. Among the many hacks I’ve made to this site, I actively try not to invade on your privacy by collecting analytics, and I try not to let others to so either!

My blog is for myself first and foremost (if you enjoy it too, that’s just a bonus). This leads to two conclusions:

  1. If I’m the primary audience, I don’t need analytics (because I know who I am), and
  2. I don’t want to be targeted by invasive analytics (and use browser extensions to block them, e.g. I by-default block all third-party scripts, delete cookies from non-allowlisted domains 15 seconds after navigating away from sites, etc.); so I’d prefer them not to be on a site for which I’m the primary audience!

I’ve gone into more detail about this on my privacy page and hinted at it on my colophon. But I don’t know if anybody ever reads either of those pages, of course!

Wacom drawing tablets track the name of every application that you open

This is a repost promoting content originally published elsewhere. See more things Dan's reposted.

I don’t care whether anything materially bad will or won’t happen as a consequence of Wacom taking this data from me. I simply resent the fact that they’re doing it.

The second is that we can also come up with scenarios that involve real harms. Maybe the very existence of a program is secret or sensitive information. What if a Wacom employee suddenly starts seeing entries spring up for “Half Life 3 Test Build”? Obviously I don’t care about the secrecy of Valve’s new games, but I assume that Valve does.

We can get more subtle. I personally use Google Analytics to track visitors to my website. I do feel bad about this, but I’ve got to get my self-esteem from somewhere. Google Analytics has a “User Explorer” tool, in which you can zoom in on the activity of a specific user. Suppose that someone at Wacom “fingerprints” a target person that they knew in real life by seeing that this person uses a very particular combination of applications. The Wacom employee then uses this fingerprint to find the person in the “User Explorer” tool. Finally the Wacom employee sees that their target also uses “LivingWith: Cancer Support”.

Remember, this information is coming from a device that is essentially a mouse.

Interesting deep-dive investigation into the (immoral, grey-area illegal) data mining being done by Wacom when you install the drivers for their tablets. Horrifying, but you’ve got to remember that Wacom are unlikely to be a unique case. I had a falling out with Razer the other year when they started bundling spyware into the drivers for their keyboards and locking-out existing and new customers from advanced features unless they consented to data harvesting.

I’m becoming increasingly concerned by the normalisation of surveillance capitalism: between modern peripherals and the Internet of Things, we’re “willingly” surrendering more of our personal lives than ever before. If you haven’t seen it, I’d also thoroughly recommend Data, the latest video from Philosophy Tube (of which I’ve sung the praises before).

Third party

This is a repost promoting content originally published elsewhere. See more things Dan's reposted.

…why would cookies ever need to work across domains? Authentication, shopping carts and all that good stuff can happen on the same domain. Third-party cookies, on the other hand, seem custom made for tracking and frankly, not much else.

Then there’s third-party JavaScript.

In retrospect, it seems unbelievable that third-party JavaScript is even possible. I mean, putting arbitrary code—that can then inject even more arbitrary code—onto your website? That seems like a security nightmare!

I imagine if JavaScript were being specced today, it would almost certainly be restricted to the same origin by default.

Jeremy hits the nail on the head with third-party cookies and Javascript: if the Web were invented today, there’s no way that these potentially privacy and security-undermining features would be on by default, globally. I’m not sure that they’d be universally blocked at the browser level as Jeremy suggests, though: the Web has always been about empowering developers, acting as a playground for experimentation, and third-party stuff does provide benefits: sharing a login across multiple subdomains, for example (which in turn can exist as a security feature, if different authors get permission to add content to those subdomains).

Instead, then, I imagine that a Web re-invented today would treat third-party content a little like we treat CORS or we’re beginning to treat resource types specified by Content-Security-Policy and Feature-Policy headers. That is, website owners would need to “opt-in” to which third-party domains could be trusted to provide content, perhaps subdivided into scripts and cookies. This wouldn’t prohibit trackers, but it would make their use less of an assumed-default (develolpers would have to truly think about the implications of what they were enabling) and more transparent: it’d be very easy for a browser to list (and optionally block, sandbox, or anonymise) third-party trackers could potentially target them, on a given site, without having to first evaluate any scripts and their sources.

I was recently inspired by Dave Rupert to remove Google Analytics from this blog. For a while, there’ll have been no third-party scripts being delivered on this site at all, except through iframes (for video embedding etc., which is different anyway because there’s significantly less scope leak). Recently, I’ve been experimenting with Jetpack because I get it for free through my new employer, but I’m always looking for ways to improve how well my site “stands alone”: you can block all third-party resources and this site should still work just fine (I wonder if I can add a feature to my service worker to allow visitors to control exactly what third party content they’re exposed to?).

Goodbye Google Analytics, Hello Fathom

This is a repost promoting content originally published elsewhere. See more things Dan's reposted.

Big news! This site is no longer using Google Analytics and I’ve switched to a self-hosted version of brand new analytics product Fathom.

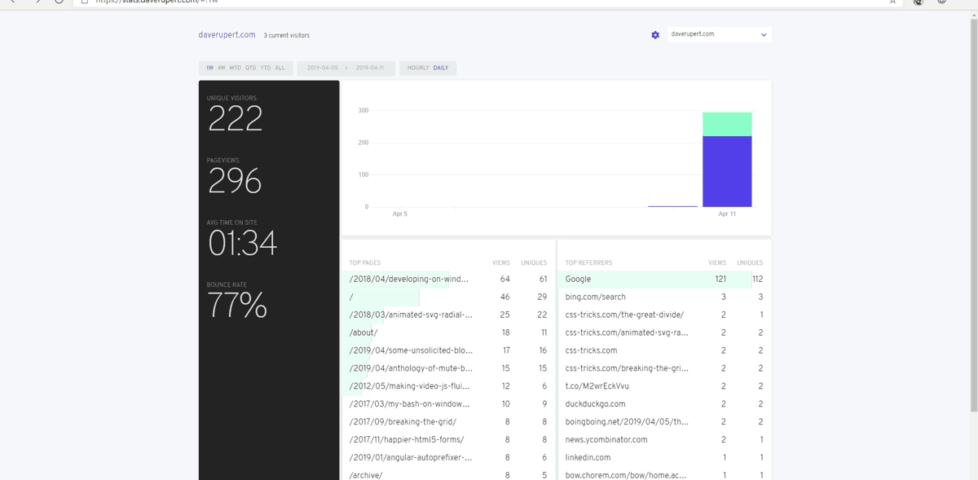
Fathom Analytics dashboard


Fathom is very simple. It only tracks 4 things: Unique Visitors, Page Views, Time on Site, and Bounce Rate. It shows me a chart of page views and visitors and then gives me a break down of referrers and top performing content. That’s it. And to be quite honest, that’s about all I need from my blog analytics.

You know what, Dave:me too! I’ve been running Google Analytics since forever and Piwik/Matomo (in parallel with it) for about a year and honestly: I get more than enough of what I need from the latter. So you’ve inspired me to cut the line with Google: after all, all I was doing was selling them my friends’ data in exchange for some analytics I wasn’t really paying attention to… and I’d frankly rather not.

So: for the first time in a decade or so, there’s no Google Analytics on this site. Woop!

Update 2023-12-13: I eventually went further still and dropped all analytics, even self-hosted variants, and it feels great.

Minimal Google Analytics Snippet

This is a repost promoting content originally published elsewhere. See more things Dan's reposted.

<script>
(function(a,b,c){var d=a.history,e=document,f=navigator||{},g=localStorage,
h=encodeURIComponent,i=d.pushState,k=function(){return Math.random().toString(36)},
l=function(){return g.cid||(g.cid=k()),g.cid},m=function(r){var s=[];for(var t in r)
r.hasOwnProperty(t)&&void 0!==r[t]&&s.push(h(t)+"="+h(r[t]));return s.join("&")},
n=function(r,s,t,u,v,w,x){var z="https://www.google-analytics.com/collect",
A=m({v:"1",ds:"web",aip:c.anonymizeIp?1:void 0,tid:b,cid:l(),t:r||"pageview",
sd:c.colorDepth&&screen.colorDepth?screen.colorDepth+"-bits":void 0,dr:e.referrer||
void 0,dt:e.title,dl:e.location.origin+e.location.pathname+e.location.search,ul:c.language?
(f.language||"").toLowerCase():void 0,de:c.characterSet?e.characterSet:void 0,
sr:c.screenSize?(a.screen||{}).width+"x"+(a.screen||{}).height:void 0,vp:c.screenSize&&
a.visualViewport?(a.visualViewport||{}).width+"x"+(a.visualViewport||{}).height:void 0,
ec:s||void 0,ea:t||void 0,el:u||void 0,ev:v||void 0,exd:w||void 0,exf:"undefined"!=typeof x&&
!1==!!x?0:void 0});if(f.sendBeacon)f.sendBeacon(z,A);else{var y=new XMLHttpRequest;
y.open("POST",z,!0),y.send(A)}};d.pushState=function(r){return"function"==typeof d.onpushstate&&
d.onpushstate({state:r}),setTimeout(n,c.delay||10),i.apply(d,arguments)},n(),
a.ma={trackEvent:function o(r,s,t,u){return n("event",r,s,t,u)},
trackException:function q(r,s){return n("exception",null,null,null,null,r,s)}}})
(window,"XX-XXXXXXXXX-X",{anonymizeIp:true,colorDepth:true,characterSet:true,screenSize:true,language:true});
</script>

This is cute: a Google Analytics code snippet that results in a payload about a fiftieth of the size of the one provided by Google but still provides most of the important features.