…
Level 3: Diagrams are code
This is what the endgame should be IMO. Some things are better represented as text. Some are best understood visually. We should mix and match what works best on a case-by-case basis. Don’t try to visualize simple code. Don’t try to write code where a diagram is better.
One of the attempts was Luna. They tried dual representation: everything is code and diagram at the same time, and you can switch between the two:
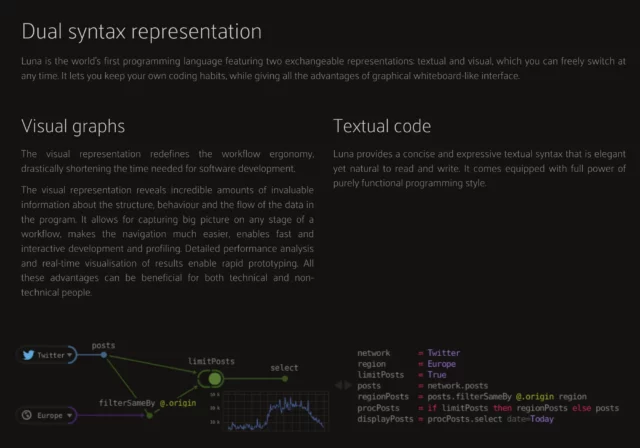
But this way, you are not only getting benefits of both ways, you are also constrained by both text and visual media at the same time. You can’t do stuff that’s hard to visualize (loops, recursions, abstractions) AND you can’t do stuff that’s hard to code.
…
Interesting thoughts from Niki (and from Sebastian Bensusan) on how diagrams and code might someday be intertwined as first class citizens (but not in the gross ways you might have come across in the past when people have tried to sell you on “visual programming”).
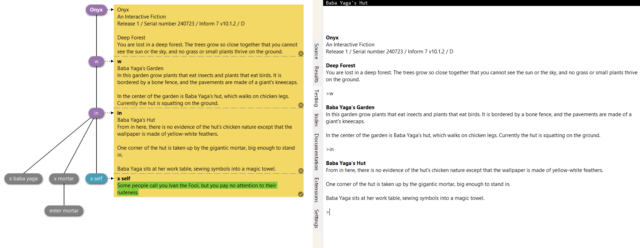
As Niki wrote about what he calls levels 2 and 3 of the concept – in which diagrams and code are intrinsically linked I found myself thinking about Twine, a programming language (or framework? or tool?… not sure how best to describe or define it!) intended for making interactive “choose your own adventure”-style hypertext fiction.
Twine’s sort-of a level 2 implementation of visual programming: the code (scene descriptions) is mostly what’s responsible for feeding the diagram. But that’s not entirely true: it’s possible to create new nodes in your story graph in a completely visual way, and then dip into them to edit their contents and imply how they link to others.
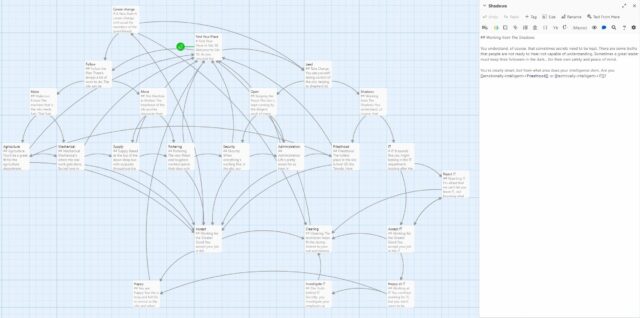
It’s possible that the IF engine community – who are working to lower the barriers to programming in order to improve accessibility to people who are fiction authors first, developers second – are ahead of the curve in the area of visual programming. Consider for example how Inform’s automated test framework graphs the permutations you (or your human testers) try, and allow you to “bless” (turn into assertions) the results so that regression testing becomes visually automated affair: